
Linux Server Monitoring CLI: Top 10 Console Tools for CPU
The classic top utility is ubiquitous, but modern server performance troubleshooting requires specialized terminal UI diagnostics. Mastering Linux Server Monitoring CLI utilizes btop (interactive multi-resource overview), iotop (per-process disk IO), iftop (network interface bandwidth), nvtop (GPU metrics), and perf (kernel-level profiling).
Table of Contents
- Beyond Basic
top: The Modern Console Monitoring Landscape - 4 Core Categories of Linux Server Monitoring CLI Tools
- Visualizing the Diagnostic Tool Selection Decision Tree
- Deep Dive: Top 10 Console Monitoring Utilities
- Frequently Asked Questions
- Conclusion & Next Steps
- Sources & Image Attributions
Beyond Basic top: The Modern Console Monitoring Landscape
When a production web server spikes to 100% load or responds with 504 Gateway Timeouts, opening an SSH session and running standard top gives only high-level summary metrics. It doesn't break down disk I/O saturation by process, isolate network socket bandwidth hogs, or reveal GPU thermal throttling.
Deploying specialized Linux Server Monitoring CLI utilities transforms terminal troubleshooting. Modern terminal applications feature responsive mouse support, interactive filtering, process tree navigation, and visual frequency graphs.
Pairing console monitoring with essential command skills from Linux Bash Commands for DevOps and package setup from Ubuntu Server Administration enables rapid bottleneck diagnosis.
4 Core Categories of Linux Server Monitoring CLI Tools
Modern terminal monitoring utilities are designed around four primary system metrics:
1. Unified Process & System Overviews
- btop & htop: Feature-rich visual dashboards tracking CPU core utilization, memory consumption, swap usage, and running process trees.
2. Disk I/O & Storage Bottleneck Trackers
- iotop & sysdig (csysdig): Isolate exact processes responsible for high disk write latency and I/O wait states (
%wa).
3. Network Bandwidth & Socket Analyzers
- iftop & wavemon: Monitor incoming/outgoing network interface throughput and real-time socket connections.
4. GPU, Hardware Thermals & Kernel Profilers
- nvtop, s-tui & perf: Inspect multi-vendor GPU utilization (Nvidia/AMD/Apple), CPU thermal stress curves, and kernel syscall traces.
Visualizing the Diagnostic Tool Selection Decision Tree
How to pick the right CLI monitoring tool for the job:
flowchart TD
    A["Server Performance Issue Detected"] --> B{"Primary Symptom?"}
    B -->|High CPU / Memory Load| C["Launch 'btop' or 'htop' (Process Tree Analysis)"]
    B -->|Sluggish Disk / High I/O Wait| D["Launch 'iotop' (Identify Disk-Writing PID)"]
    B -->|Network Saturation / Slow Transfer| E["Launch 'iftop' (Inspect Active Sockets)"]
    B -->|GPU AI Model Bottleneck| F["Launch 'nvtop' (Inspect VRAM & Power)"]
B -->|Mysterious Kernel Overhead| G["Execute 'perf' (Deep Flamegraph Trace)"]Experiencing strange color artifacts in btop over SSH? Press o to open the btop options menu, navigate to "Truecolor", and toggle it to False to restore crisp 256-color ANSI rendering.
Deep Dive: Top 10 Console Monitoring Utilities
1. btop: The Ultimate Terminal Dashboard
Features customizable layouts, responsive mouse clicks, per-core CPU graphs, memory graphs, disk status, and process kill signals (sudo apt install btop).
2. htop: The Fast Standard
Lightweight, widely pre-installed, and ideal for quick process inspection and priority renicing (sudo apt install htop).
3. s-tui: CPU Stress & Thermals
Displays real-time CPU frequency graphs and temperatures alongside a built-in stress-ng load testing engine (sudo apt install s-tui stress-ng).
4. iotop: Real-Time Disk I/O by Process
Reveals which background service is thrashing storage drives (sudo apt install iotop).
5. iftop: Network Bandwidth by Connection
Displays a real-time list of network connections sorted by bandwidth utilization (sudo apt install iftop).
6. nvtop: Multi-Vendor GPU Task Viewer
Monitors Nvidia, AMD, Intel, and Apple Silicon GPUs with detailed VRAM, compute utilization, and power draw metrics (sudo apt install nvtop).
7. perf: Linux Kernel Profiler
The gold standard for deep low-level bottleneck analysis and flamegraph generation (sudo apt install linux-perf).
Frequently Asked Questions
Which tool is best for general daily monitoring?
btop is the most comprehensive and visually intuitive dashboard for modern Linux servers.
How do I identify which process is causing high disk write activity?
Run sudo iotop -o. The -o flag filters the process list to show only processes currently performing active I/O.
Can these CLI tools run without root privileges?
Tools like htop and btop run without root for general monitoring, but viewing all system-wide processes, network sockets (iftop), or disk I/O (iotop) requires sudo privileges.
Conclusion & Next Steps
Commanding these Linux Server Monitoring CLI utilities equips sysadmins and software engineers to diagnose production bottlenecks in seconds. By using the right diagnostic tool for each metric, teams maintain 99.9% application uptime.
At Masri Systems, we architect high-performance digital platforms, developer workflow systems, and scalable software applications. Explore our specialized Software Development and Website Architecture services to build scalable digital systems for modern enterprises.
Sources & Image Attributions
- Header Image: Server computing racks by Jordan Harrison on Unsplash
- Body Image: Developer working on code review by Caspar Camille Rubin on Unsplash
Follow Masri Systems on Google
Add us as a preferred source in Google Search.
Related Articles & Guides
AI Agent Workflow Automation: Curated 123-Tool Stack
Curated directory of 123 open-source AI agent frameworks, MCP servers, and developer tools for production AI agent workflow automation and autonomous systems.
Geschäftsprozesse automatisieren: 17 Scheduled Tasks der Agentur
Wie Masri Systems 17 autonome Agenten-Jobs, Sidecars und Cron-Tasks einsetzt, um Geschäftsprozesse im Entwickler-Alltag wartungsfrei zu automatisieren.
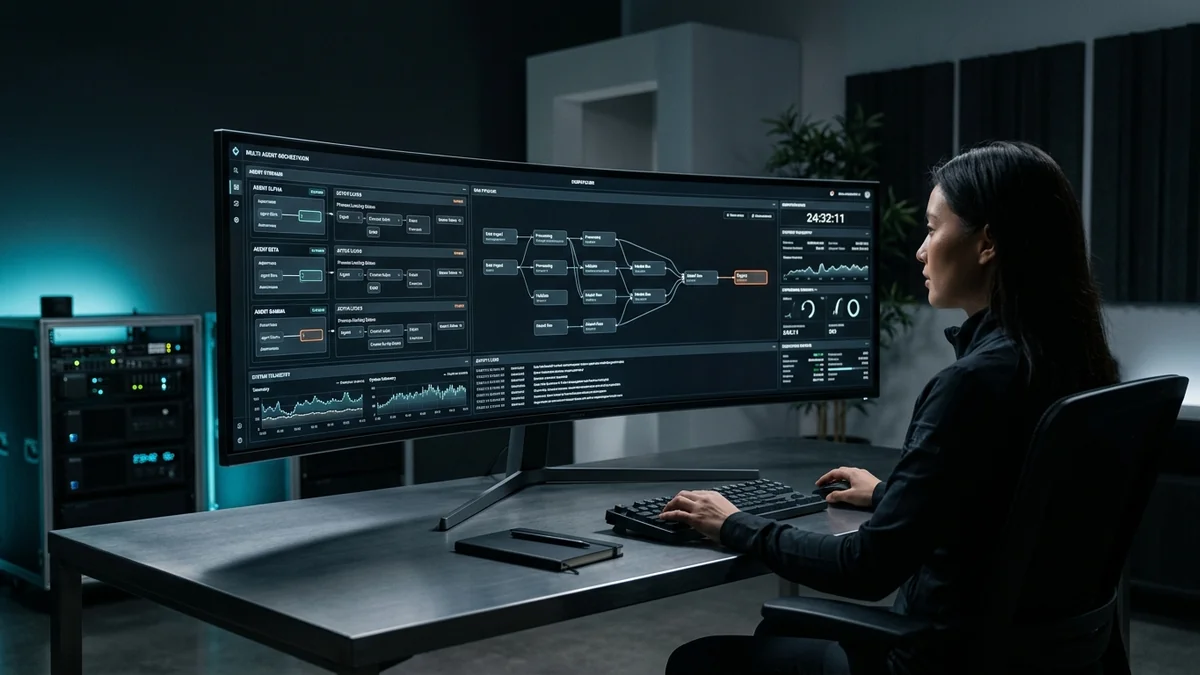
Command Center: Autonome KI Agenten Geschäftsprozesse KMU steuern
Autonome KI Agenten Geschäftsprozesse KMU: Steuern Sie Gemini, Codex und Claude parallel in einem sicheren VILT Stack Command Center mit OS-Locking.

Sectors of Computer Science & Software Engineering
Explore the primary disciplines of computer science, tech career paths, software engineering specialization tracks, and modern developer tooling.

Portable AI Agent Skills: One Skill, Every Model
Stop rewriting the same AI agent workflow for Claude, Gemini, and Codex. Build portable skills once with AI Agent Workflow Automation and sync everywhere.

Openship: A Self-Hosted Deployment Platform With No CI/CD Pipeline
Openship is an Apache 2.0 self-hosted deployment platform that skips CI/CD YAML. What v0.6.7 does well, and why pre-1.0 status should shape your rollout.

Software Engineer Career Roadmap
Explore the complete software engineer career roadmap. Master junior to senior transitions, high-demand tech specializations, and modern AI development.
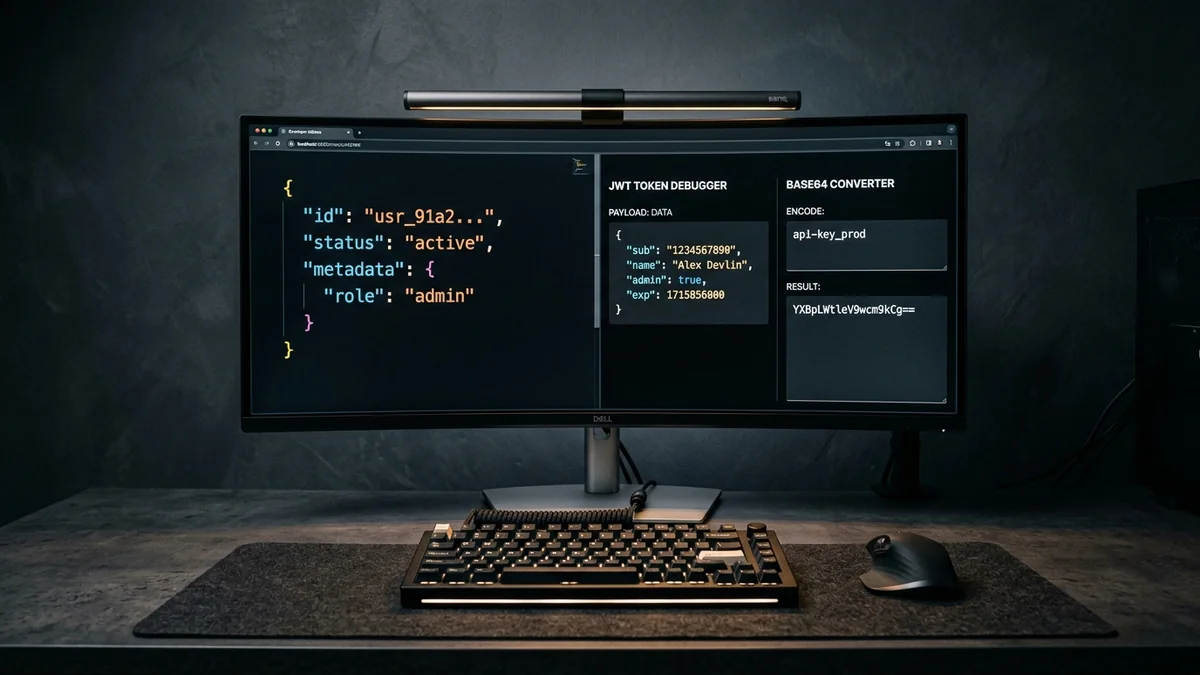
Web Development Utilities: 10 Essential Free Browser Tools
Master essential web development utilities. Discover 10 free online tools for JSON formatting, JWT decoding, HAR network analysis, Base64, and CSV/YAML.