
PostgreSQL Performance Optimization
Unoptimized database queries are the leading cause of web application latency. Implementing PostgreSQL Performance Optimization combines strategic composite indexing, EXPLAIN ANALYZE query profiling, connection pooling with PgBouncer, and Point-in-Time Recovery (PITR) to ensure data stores remain blazing fast and bulletproof under production load.
Table of Contents
- The Critical Role of PostgreSQL in Modern Architecture
- 7 Core Best Practices for PostgreSQL Performance Optimization
- Visualizing the Query Profiling & Optimization Loop
- High Availability, Replication & Connection Pooling
- Frequently Asked Questions
- Conclusion & Next Steps
- Sources & Image Attributions
The Critical Role of PostgreSQL in Modern Architecture
PostgreSQL has earned its reputation as the world's most advanced open-source relational database. With native JSONB document support, robust concurrency control (MVCC), and extensibility (PostGIS, pgvector), it serves as the foundational data layer for modern enterprise applications.
However, as datasets grow into millions of records, poor schema design and unindexed queries degrade application throughput. Mastering PostgreSQL Performance Optimization allows engineering teams to resolve slow queries before resorting to expensive vertical hardware upgrades.
Pairing disciplined database tuning with architectural patterns from Clean Architecture and backend practices from Articles/Coding/Laravel ensures applications handle heavy concurrency smoothly.
7 Core Best Practices for PostgreSQL Performance Optimization
Enterprise engineering teams enforce seven essential practices to maintain high-throughput PostgreSQL databases:
1. Strategic Indexing & Unused Index Pruning
Index foreign keys, WHERE clauses, and ORDER BY columns. Use partial indexes (WHERE active = true) to minimize index storage, and periodically audit pg_stat_user_indexes to drop unused indexes that slow down write operations.
2. Query Profiling with EXPLAIN ANALYZE
Never guess why a query is slow. Run EXPLAIN (ANALYZE, BUFFERS) to inspect sequential scans, join algorithms (Hash Join vs Nested Loop), and buffer cache hit rates.
3. Eliminate SELECT * & Avoid Over-Fetching
Select only the columns required by application use cases. Fetching unneeded text or JSONB blobs consumes database memory and saturates network bandwidth.
4. Connection Pooling with PgBouncer
PostgreSQL spawns a separate OS process for every connected client. Using PgBouncer multiplexes thousands of application requests across a small pool of database connections, preventing memory exhaustion.
5. Point-in-Time Recovery (PITR) & WAL Archiving
Pair daily physical backups with continuous Write-Ahead Log (WAL) archiving to enable restoration to any precise second in the event of hardware failure or human error.
6. Automated Maintenance: VACUUM & ANALYZE
Ensure autovacuum is tuned appropriately to clean dead tuple bloat and update query planner distribution statistics (ANALYZE) on write-heavy tables.
7. Table Partitioning for High-Volume Time-Series Data
Partition multi-gigabyte audit logs or transaction tables by date range to enable partition pruning during queries and simplify bulk data archival.
Visualizing the Query Profiling & Optimization Loop
Optimizing slow database endpoints follows a deterministic engineering sequence:
flowchart TD
    A["Slow Query Flagged in Logs (pg_stat_statements)"] --> B["Run EXPLAIN (ANALYZE, BUFFERS)"]
    B --> C{"Identify Dominant Cost"}
    C -->|Sequential Scan on Large Table| D["Add Targeted Composite / Partial Index"]
    C -->|Inefficient Join on Large Dataset| E["Refactor Query & Tune work_mem"]
    C -->|High Disk I/O Reads| F["Increase shared_buffers & Add Caching"]
    D --> G["Re-benchmark Execution Latency (<10ms target)"]
    E --> G
F --> GAlways enable pg_stat_statements in postgresql.conf. This extension tracks total execution time, call counts, and mean latency across all queries, pinpointing the top 5 slow queries consuming 80% of server CPU.
High Availability, Replication & Connection Pooling
For mission-critical enterprise systems:
- Streaming Replication: Maintain asynchronous or synchronous standby replicas for instant automated failover.
- Read-Write Splitting: Route heavy analytics queries to read replicas, preserving the primary master for transactional writes.
- SSL/TLS Encryption: Enforce encrypted database connections (
sslmode=require) for all application nodes.
Frequently Asked Questions
What is the most common reason for slow PostgreSQL queries?
Missing indexes on foreign keys and filtering columns, which forces PostgreSQL to perform full sequential scans across entire tables on disk.
How does PgBouncer improve application performance?
By eliminating the overhead of process creation for each new web request, connection poolers reduce connection latency and allow servers to sustain 10x higher concurrent user traffic.
When should table partitioning be implemented in PostgreSQL?
Implement table partitioning when individual tables exceed several tens of millions of rows or when historical data needs to be routinely purged by dropping partitions.
Conclusion & Next Steps
Disciplined PostgreSQL Performance Optimization transforms struggling databases into blazing-fast, scalable storage engines. By indexing strategically, profiling queries with EXPLAIN, and pooling connections, developers build resilient backend infrastructure.
At Masri Systems, we architect high-performance digital platforms, enterprise database systems, and custom backend infrastructure. Explore our specialized Software Development and Website Architecture services to elevate your database performance.
Sources & Image Attributions
- Header Image: Server computing racks by Jordan Harrison on Unsplash
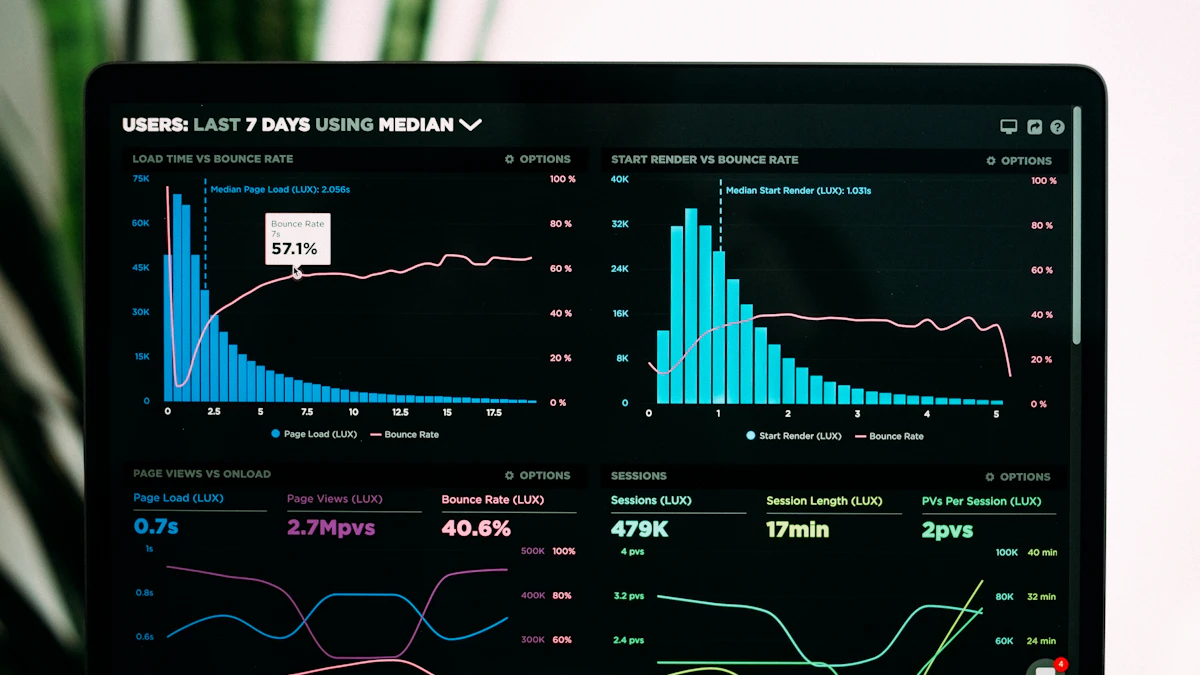
- Body Image: Software metrics dashboard by Luke Chesser on Unsplash
Follow Masri Systems on Google
Add us as a preferred source in Google Search.
Related Articles & Guides

Universal SEO & GEO Checklist 2026: Search and AI Engine Guide
Master technical search with the Universal SEO and GEO Checklist 2026. Audit Core Web Vitals, JSON-LD schemas, and AI crawler citations for peak visibility.

Free Developer Certifications: 5 High-Impact Courses & Badges
5 verifiable free developer certifications and coding courses from Postman, Google Cloud, DeepLearning.AI, and freeCodeCamp to elevate your engineering resume.

Why PHP 8.4 & Laravel Are the Smartest Choice for Web Apps
Explore modern PHP web development. Discover why PHP 8.4 performance, strict typing, JIT compilation, and Laravel make PHP the top choice for software teams.

Web Application Performance Optimization
Boost backend and frontend speed with actionable web application performance optimization tactics. Eliminate N+1 queries, memory leaks, and CPU cache misses.

Vite Build Performance Optimization
Master Vite build performance optimization. Learn how to eliminate barrel file bottlenecks, configure dynamic code splitting, and optimize Rollup bundles.

The Ultimate Toolkit for Laravel, SQL, APIs & Performance
Explore the best backend engineering resources in 2026. Discover curated SQL terminals, Laravel optimization guides, passkey security, and database.
The Complete Engineering Guide to Systems, Databases & DevOps
Master the complete backend development roadmap. Learn server-side languages, relational and NoSQL databases, API design, and containerized DevOps pipelines.

Laravel Vue Production Deployment
Master Laravel Vue production deployment. Step-by-step guide to Vite bundling, production .env configuration, cache optimization, cron scheduling, and SSL.