
Web Application Performance Optimization

Applications that work in local development often grind to a halt under real-world production load. Mastering web application performance optimization requires identifying and resolving root bottlenecks—including N+1 database queries, cache-miss patterns, and excessive memory allocation churn—before scaling infrastructure costs.
Table of Contents
- The Performance Dilemma: Working Code vs Fast Code
- 5 Critical Code Performance Bottlenecks & Fixes
- Visualizing the Performance Triage Pipeline
- Profiling-First Methodology: Measure Before Refactoring
- Frequently Asked Questions
- Conclusion & Next Steps
- Sources & Image Attributions
The Performance Dilemma: Working Code vs Fast Code
Software engineers frequently focus on functional correctness during early development sprints. However, when traffic spikes, hidden architectural inefficiencies manifest as sluggish page loads, database timeouts, and ballooning cloud server invoices.
Effective web application performance optimization is not about micro-optimizing every loop. It is about systematically isolating structural choke points that throttle throughput.
Pairing disciplined code optimization with principles from Clean Architecture and Apply the 80-20 Principle for Productivity ensures applications handle exponential user concurrency with minimal hardware overhead.
5 Critical Code Performance Bottlenecks & Fixes
Here are the five most common technical traps that degrade application speed, along with standard architectural remediations:
1. The N+1 Database Query Trap
- The Bottleneck: Executing individual SQL queries inside loops (e.g., loading a list of 100 users, then running 100 separate queries to fetch their profiles).
- The Fix: Implement eager loading using SQL
IN (...)clauses or ORM batch-fetching mechanisms to retrieve all required relations in a single round-trip.
2. Cache-Oblivious Data Structures & Traversal
- The Bottleneck: Accessing multi-dimensional arrays or non-contiguous data structures against memory storage order, causing constant CPU L1/L2 cache misses.
- The Fix: Align loop iterations with physical memory layout (row-major vs column-major) and favor contiguous array buffers over fragmented pointer graphs.
3. Synchronous Logging & I/O Blocking in Hot Paths
- The Bottleneck: Writing verbose debug logs or calling third-party analytics synchronously inside latency-sensitive request handlers.
- The Fix: Dispatch non-essential telemetry and logging to asynchronous background queues (such as Redis-backed workers).
4. Excessive Object Churn & Memory Fragmentation
- The Bottleneck: Repeatedly instantiating and discarding temporary objects inside tight loops, triggering aggressive garbage collection pauses.
- The Fix: Utilize object pooling, array views (e.g.,
memoryviewin Python,ArrayBufferin JavaScript), and primitive collections in high-throughput routines.
5. Redundant Data Cloning
- The Bottleneck: Deep-copying large datasets across intermediary transformation layers instead of passing immutable references.
- The Fix: Use read-only slices, iterators, and streaming pipelines to process datasets without duplicating memory footprints.

Visualizing the Performance Triage Pipeline
Disciplined engineering teams follow a systematic profiling and remediation cycle:
flowchart LR
    A["Reported Latency Spike / Bottleneck"] --> B["Profile Execution (APM / Flamegraphs / Query Logs)"]
    B --> C{"Identify Dominant Cost"}
    C -->|Database Latency| D["Eager Loading & Composite Indexing"]
    C -->|CPU / Memory Churn| E["Optimize Data Structures & Algorithms"]
    C -->|Blocking I/O| F["Decouple into Asynchronous Queues"]
    D --> G["Automated Benchmark Verification (CI Regression Gate)"]
    E --> G
F --> GNever refactor for speed based on intuition. Always capture flamegraphs, slow query logs, and memory allocation profiles to identify the genuine 5% of code consuming 95% of execution time.
Profiling-First Methodology: Measure Before Refactoring
Premature optimization introduces unnecessary code complexity. To maintain clean, readable code while achieving exceptional speed:
- Instrument APM Telemetry: Use tools like Laravel Telescope, OpenTelemetry, or Chrome DevTools to monitor real user transactions.
- Set Performance Budgets: Enforce automated CI regression checks that alert developers if a pull request increases query counts or response payloads.
- Index Intelligently: Ensure all database
WHERE,ORDER BY, and foreign key columns have appropriate composite indexes before rewriting queries.
Frequently Asked Questions
What is the difference between CPU-bound and I/O-bound bottlenecks?
CPU-bound tasks are constrained by processing calculations and memory traversal (e.g., image compression). I/O-bound tasks are delayed by external communication (e.g., waiting for database responses or third-party APIs).
How can I detect N+1 queries automatically?
Enable query detection packages (such as Laravel's Model::preventLazyLoading() or Rails Bullet) during automated test runs to instantly flag missing eager loads.
When should caching (e.g., Redis) be introduced?
Introduce caching after optimizing database queries and indexes. Caching over an unoptimized database masks architectural flaws without fixing underlying data modeling issues.
Conclusion & Next Steps
Building blazing-fast web applications is an architectural discipline. By implementing proven web application performance optimization principles, you deliver smooth user experiences, reduce server infrastructure bills, and scale smoothly.
At Masri Systems, we architect high-throughput web applications and optimize complex digital platforms for speed and reliability. Explore our tailored Software Development and Website Architecture services to see how we build resilient digital infrastructure.
Sources & Image Attributions
- Header Image: Abstract technology light motion by NASA on Unsplash
- Body Image: High performance server computing racks by Jordan Harrison on Unsplash
Follow Masri Systems on Google
Add us as a preferred source in Google Search.
Related Articles & Guides

Universal SEO & GEO Checklist 2026: Search and AI Engine Guide
Master technical search with the Universal SEO and GEO Checklist 2026. Audit Core Web Vitals, JSON-LD schemas, and AI crawler citations for peak visibility.

Free Developer Certifications: 5 High-Impact Courses & Badges
5 verifiable free developer certifications and coding courses from Postman, Google Cloud, DeepLearning.AI, and freeCodeCamp to elevate your engineering resume.

Why PHP 8.4 & Laravel Are the Smartest Choice for Web Apps
Explore modern PHP web development. Discover why PHP 8.4 performance, strict typing, JIT compilation, and Laravel make PHP the top choice for software teams.

Webdesign Portfolio Inspiration
Discover top webdesign portfolio inspiration. Explore curated developer showcases, creative agency landing pages, and best practices for conversion and UI.

Web Development Utilities: 10 Essential Free Browser Tools
Master essential web development utilities. Discover 10 free online tools for JSON formatting, JWT decoding, HAR network analysis, Base64, and CSV/YAML.
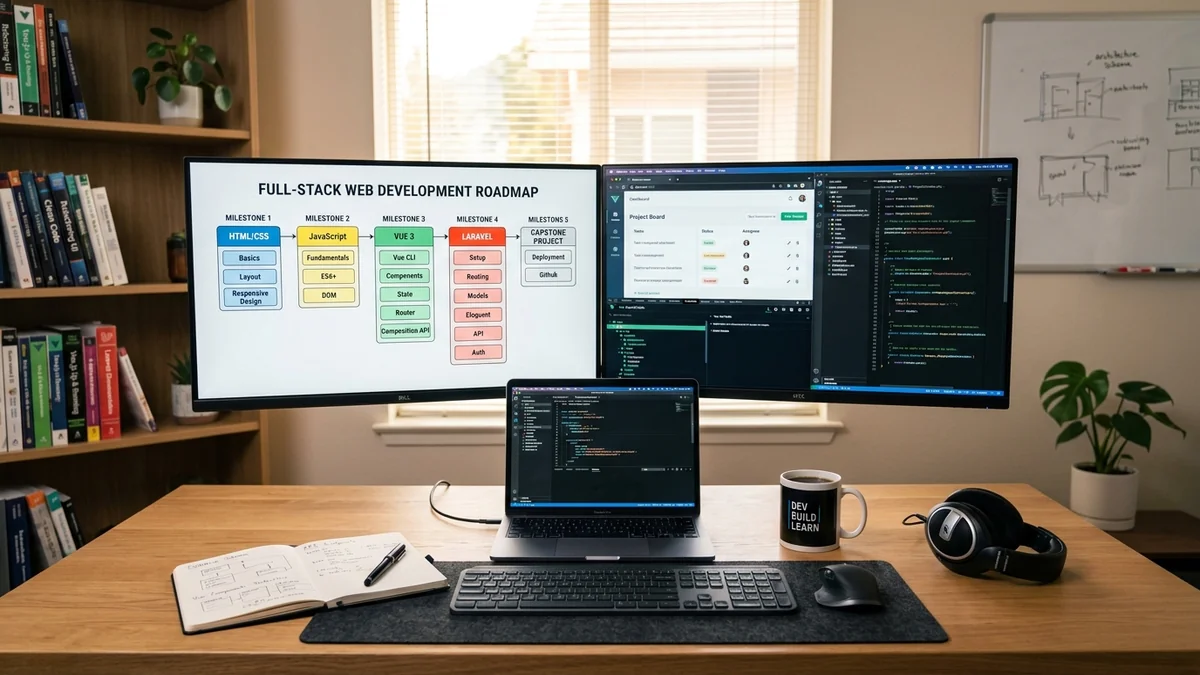
Web Development Curriculum: Full
Master full-stack web development. Comprehensive curriculum covering HTML/CSS/Tailwind, ES6+ JavaScript, Vue 3 & Vite, Laravel APIs, and CI/CD deployment.

Vue JS Application Architecture
Master Vue JS application architecture. Comprehensive scaffolding guide covering TypeScript interfaces, modular directory structure, Pinia, and VueUse.

Vite Build Performance Optimization
Master Vite build performance optimization. Learn how to eliminate barrel file bottlenecks, configure dynamic code splitting, and optimize Rollup bundles.